Developers
What is ELK? | Storm Internet
Scanning logs, and sometimes storing them, is crucial for purposes of performance monitoring, compliance with regulations, data analytics, and security monitoring. So, it is natural that these days when most people are using opensource software, ELK is one of the most popular ways to do that. Or they use Splunk, which is proprietary. Here we look at ELK
ELK is an acronym for ElasticSearch, LogStash, and Kibana. Their functions are:
Logstash—is designed to receive logs from different sources at a very high rate.
ElasticSearch—this takes log data and stores it in JSON format, meaning it is not necessary to create a schema ahead of time, as you would with a RDBMS. ElasticSearch runs across a distributed architecture too, like Apache Hadoop or Spark. That means it can scale without limit and has redundancy.
Kibana—is a query and visualization tool. It is built specifically to work with ElasticSearch.
ELK is usually paired with the following components as well:
Filebeat-think of this as a Logstash file forwarder. It watches a directory and sends files found there to Logstash for further processing. Of course, there are many other ways you can send data to Logstash, like using tcp or udp.
Nginx-people often use the Nginx webserver with Kibana as a reverse proxy server. That exposes it on the internet with a simple http:://(some address) on port 80. That way you do not have to change firewall rules to use Kibana across the network. In many organizations, and with certain cloud providers, there are often bureaucratic or technical roadblocks to modifying firewall rules that.
Here is a typical scenario of how you might use ELK: Apache->Filebeat->Logstash->ElasticSearch->Kibana->Nginx
Let’s look at each piece:
Apache logs have a specific file format. If you do not use Logstash, with some older products you might have to configure a file mapping to convert log events to a format that would fit into whatever logging product you use, like the ArcSight CEF (common event) file format. Sometimes that can be complicated and time-consuming. But with Logstash that might not be necessary. It has lots of plugins. One of those is Grok. That looks at input data and takes a guess and how to parse that into individual fields.
Now, it does not matter what format Logstash stores its data. Because what that does is pass log events to ElasticSearch, which is a noSQL JSON database. JSON (JavaScript Object Notation), is self-describing meaning there is no need to create a schema.
So it is simpler than dealing with something like Oracle, where you would have to define data fields, lengths and so forth. So, if we have an Apache log entry like this:
83.149.9.216 - - [04/Jan/2015:05:13:42 +0000] "GET /presentations/logstash-monitorama-2013/images/kibana-search.png HTTP/1.1" 200 203023 "http://semicomplete.com/presentations/logstash-monitorama-2013/" "Mozilla/5.0 (Macintosh; Intel Mac OS X 10_9_1) AppleWebKit/537.36 (KHTML, like Gecko) Chrome/32.0.1700.77 Safari/537.36" (source: ElasticSearch) Then in ElasticSearch it gets stored like this: { "clientip" : "83.149.9.216", "ident" : , "auth" : , "timestamp" : "04/Jan/2015:05:13:42 +0000", "verb" : "GET", "request" : "/presentations/logstash-monitorama-2013/images/kibana-search.png", "httpversion" : "HTTP/1.1", "response" : "200", "bytes" : "203023", "referrer" : "http://semicomplete.com/presentations/logstash-monitorama-2013/", "agent" : "Mozilla/5.0 (Macintosh; Intel Mac OS X 10_9_1) AppleWebKit/537.36 (KHTML, like Gecko) Chrome/32.0.1700.77 Safari/537.36" }
(source: ElasticSearch)
We say it is self-describing because each field has the field name right next to it. That is why you do not need to create a schema.
Apache Lucene Search
While you store data in ElasticSearch, you query it with Kibana. Kibana queries are handled by yet another opensource tool, Apache Lucene Query. This is a powerful query language that lets you search using rather simple syntax.
For example, you can type field names and search on that or just type in text and see if it matches any of the data in the log entry.
So, given the Apache example above you could write: clientip: 83.149.9.216
Or you could use wildcards like: Clientip: 83.149.*.*
And then you can do what Google search does which is use what are called Fuzzy searches to let you find items even when you have spelled them wrong. So you would write:
roam~
Which would also return “foam.”
There are many more possibilities, like searching by a date range or finding log records with two words a specific distance apart.
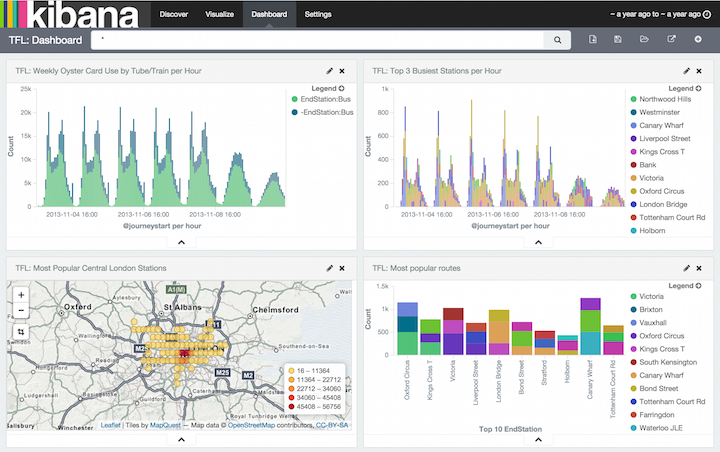
Kibana Visualizations
The simplest application of Kibana is to query data and list it on the screen. But Kibana also lets you can create graphs, like bar charts.
You can make several graphs that are somehow related and then put them together on one dashboards like this stunning example below.

Graphic source: ElasticSearch
In this example, data records are groups by the geographical location of the source IP address. That data is easily obtained from another Logstash plugin, called geoip.
So to use Kibana for multiple users and multiple purpose, you could have a dashboard for, say, performance monitoring, another to show web traffic by geographical location, one to flag security events, another to look for errors in application code, and one to show sales data.
Every organization needs some enterprise mechanism to gather logs. ELK is a popular one that is both easy to configure and that will not go out of date any time soon, because so many people are using it. And it is free.
If you’d like super-fast hosting for your web site, call us on 0800 817 4727. We’ve been providing ultra fast, secure web hosting services since 2004 and know a thing or two about optimising servers and sites for speed.
More related news

Cloud Hosting
Cloud Server vs VPS: What’s the Difference and Which Is Better for Your Business?
If you’re running a SaaS platform, digital agency, ecommerce store, education portal,...

Developers
Low-code + custom: when to use low-code tools in your SaaS stack (and when not to)
Low-code has become a practical part of many SaaS stacks – because...
Speak with a Storm Expert
Please leave us your details and we'll be in touch shortly
A Trusted Partner